For homeowners, real estate investors, and prospective buyers, understanding the financial landscape of New Jersey requires a clear look at local property tax distributions. New Jersey maintains the highest average effective property tax rate in the United States, hovering at a statewide average of approximately 2.23%. However, looking only at this state level average hides significant differences between regions.
Property taxes in the Garden State are not uniform. They are determined by individual municipal budgets, regional school district funding requirements, and county infrastructure levies. To understand your true tax burden, you must analyze property values alongside county specific tax structures. This authoritative dashboard guide breaks down the official rankings of all 21 New Jersey counties from highest to lowest, based on the latest verified data from the New Jersey Division of Taxation.

Understanding General Tax Rate vs. Effective Tax Rate
Before analyzing the county rankings, it is essential to distinguish between the two primary metrics used in municipal tax reporting. The General Tax Rate and the Effective Tax Rate (or Equalized Tax Rate).
- General Tax Rate. This is the raw percentage applied directly to your home’s local assessed value determined by your town assessor. Because individual towns may not revalue properties for years, assessed values can fall significantly out of line with actual market realities.
- Effective Tax Rate. This metric adjusts for local valuation discrepancies by converting all property assessments to 100% of true market value. It serves as the definitive standard for comparing the actual tax burden across different municipalities and counties fairly.
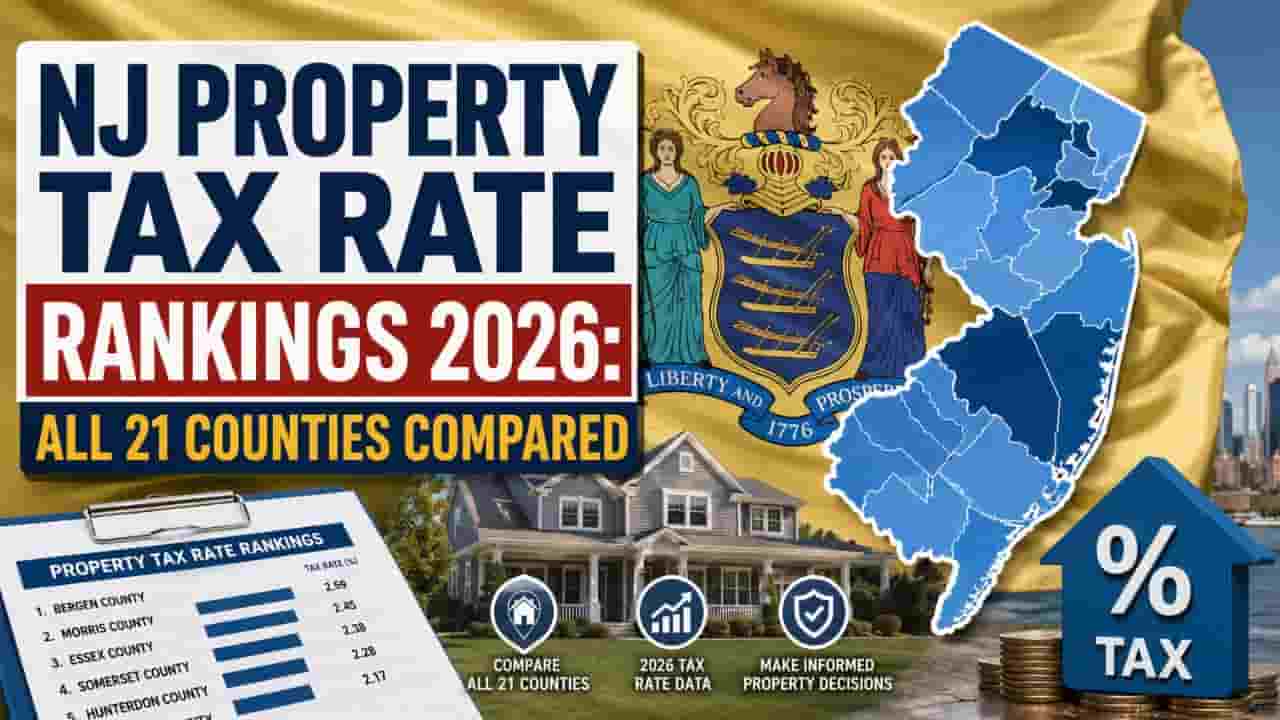
The Complete 2026 New Jersey County Property Tax Dashboard
The table below provides a comprehensive comparison of all 21 New Jersey counties. It ranks them by their average effective tax rate while displaying the matching average annual residential property tax bill.
| County Rank | New Jersey County | Average Effective Tax Rate | Average Annual Tax Bill |
| 1 | Camden County | 3.42% | $7,725 |
| 2 | Passaic County | 3.21% | $11,314 |
| 3 | Essex County | 3.11% | $14,460 |
| 4 | Gloucester County | 3.08% | $7,595 |
| 5 | Salem County | 3.05% | $6,842 |
| 6 | Union County | 2.94% | $12,019 |
| 7 | Cumberland County | 2.89% | $5,114 |
| 8 | Burlington County | 2.78% | $7,650 |
| 9 | Mercer County | 2.71% | $10,422 |
| 10 | Hudson County | 2.59% | $9,485 |
| 11 | Middlesex County | 2.44% | $9,320 |
| 12 | Atlantic County | 2.38% | $7,301 |
| 13 | Sussex County | 2.34% | $8,245 |
| 14 | Warren County | 2.31% | $7,910 |
| 15 | Bergen County | 2.22% | $13,992 |
| 16 | Ocean County | 2.15% | $7,110 |
| 17 | Monmouth County | 2.06% | $10,885 |
| 18 | Somerset County | 2.01% | $12,082 |
| 19 | Morris County | 1.96% | $12,259 |
| 20 | Hunterdon County | 1.88% | $11,920 |
| 21 | Cape May County | 1.41% | $6,687 |
Note. Data compiled from certified abstracts of ratables provided by the New Jersey Department of the Treasury.
Key Regional Real Estate Tax Dynamics
Analyzing the table reveals an important operational paradox in New Jersey real estate, a higher tax rate percentage does not always equal a higher total cash tax bill. This disconnect is driven directly by regional market valuations.
The Urban Suburban Inversion, Essex vs Camden
Consider Camden County, which holds the highest average effective tax rate in the state at 3.42%. Because median property values in Camden are lower than the state average, the typical annual cash tax bill remains around $7,725.
Conversely, Essex County has a lower effective tax rate percentage (3.11%), but it commands the highest average annual tax bill in the state at $14,460. This is due to the high market value of residential properties in suburban areas like Millburn, Montclair, and Glen Ridge.
The Coastal Exception, Cape May County
Cape May County consistently anchors the bottom of the property tax rankings, featuring an average effective rate of just 1.41%. Coastline economies benefit from exceptionally high ratable values along oceanfront sectors like Avalon, Stone Harbor, and Ocean City. This massive concentration of commercial and high end residential real estate generates significant revenue, allowing the local government to maintain low tax rates for county residents.
Core Pillars Driving Your Local Property Tax Bill
Your property tax bill funds three distinct layers of local governance. Understanding how your money is allocated helps clarify why certain regions experience steeper annual rate adjustments.
Your Total NJ Property Tax Bill
50% to 60% ➔ Local & Regional School Districts
20% to 30% ➔ Municipal Government Operations
15% to 20% ➔ County Government Infrastructure
1. School District Budgets
On average, 50% to 60% of every property tax dollar collected in New Jersey goes directly toward funding local elementary, middle, and high school districts. Towns with expanding student populations or those building new facilities face higher voter approved school board levies.
2. Municipal Government Purpose
Approximately 20% to 30% of your payment funds municipal operations. This covers local public safety (police, fire, and EMS departments), road maintenance, trash collection, and town administrative staff.
3. County Administration
The remaining 15% to 20% is collected by your municipality and forwarded to your county seat. These funds support regional infrastructure projects, county park systems, judicial facilities, and county correctional facilities.
Actionable Steps for NJ Property Owners and Buyers
To manage these high tax environments successfully, implement this step by step approach when buying a home or managing an existing asset.
Step 1. Analyze Local Townships Independently
County averages provide a helpful baseline, but property taxes are ultimately determined at the township level. Before making an offer on a home, use a targeted County Specific Property Tax Calculator to evaluate the exact effective tax rate of the specific municipality you are targeting.
Step 2. Track Municipal Revaluation Cycles
When a township conducts a full scale property revaluation to bring assessments up to current market values, it can quickly destabilize your monthly mortgage escrow setup. Check your local assessor’s public records to see when the last comprehensive revaluation took place.
Step 3. Review Available State Relief Options
If your rising property tax bill impacts your household budget, determine your eligibility for state relief programs. Programs like the ANCHOR Property Tax Relief Program and the Senior Freeze (Stay NJ) provide direct financial credits to qualifying homeowners and renters.
Conclusion
Understanding New Jersey’s property tax rankings requires evaluating both regional effective rates and local property valuations together. While southern counties like Camden exhibit higher rate percentages on paper, northern real estate hubs like Essex and Bergen produce much larger cash liabilities due to their higher property values. By researching specific municipal tax structures, planning ahead for revaluation cycles, and utilizing accurate calculation tools, buyers and property owners can make informed decisions that protect their household budgets.
FAQs
Which New Jersey county has the highest property taxes?
Essex County levies the highest average cash property tax bill at $14,460, while Camden County maintains the highest effective tax rate percentage at 3.42%.
Which NJ county features the lowest property tax rates?
Cape May County has the lowest property taxes in New Jersey, with an effective tax rate of 1.41%, driven by high coastal real estate values.
What is an effective property tax rate?
The effective tax rate represents the ratio of current property taxes to the true market value of the home, allowing for accurate comparisons across different towns.
How often do property tax rates change in New Jersey?
Property tax rates change annually following local school board elections, municipal budgeting sessions, and county infrastructure spending approvals.
Does a town revaluation always increase my property taxes?
No. A revaluation updates assessments to reflect market value. Your tax bill only increases if your property’s value grew faster than the township’s average growth rate.
Why does a mortgage lender manage property taxes through escrow?
Lenders collect 1/12th of your annual tax bill monthly to pay the municipality directly on the standard quarterly due dates, protecting the property from tax liens.
How can I calculate my true monthly PITI payment in NJ?
To find your total monthly payment, combine your loan’s principal and interest with local property taxes, homeowners insurance premiums, and any private mortgage insurance using a localized financial calculator.